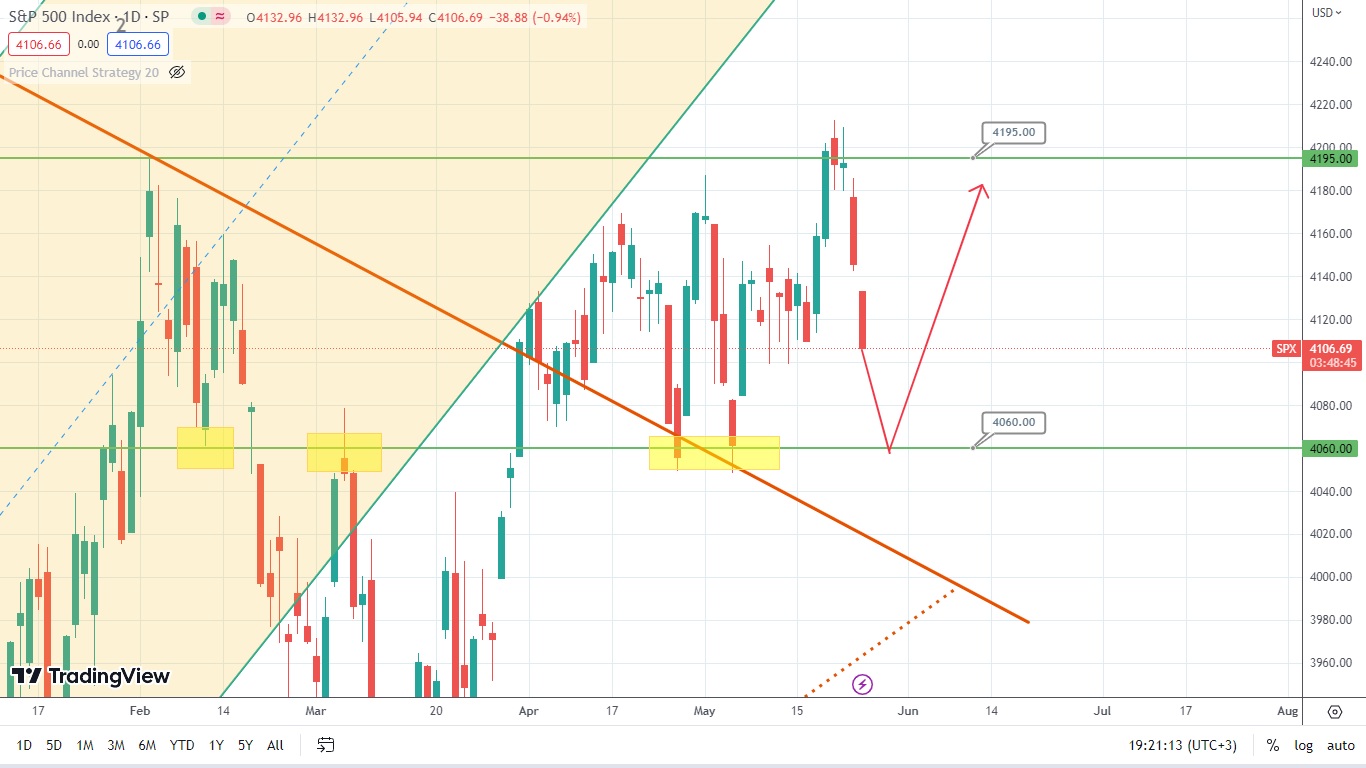
S&P500 is Trading Flat: What’s Next?

American stock index S&P500 rebounded from the upper boundary of the range, that is, the resistance level of 4195. Currently, the index is going down, targeting the opposite side of the range. The price of the index is likely to rebound from the supporting level of 4060 and head toward the opposite boundary of the range. So, let’s observe what might happen next.
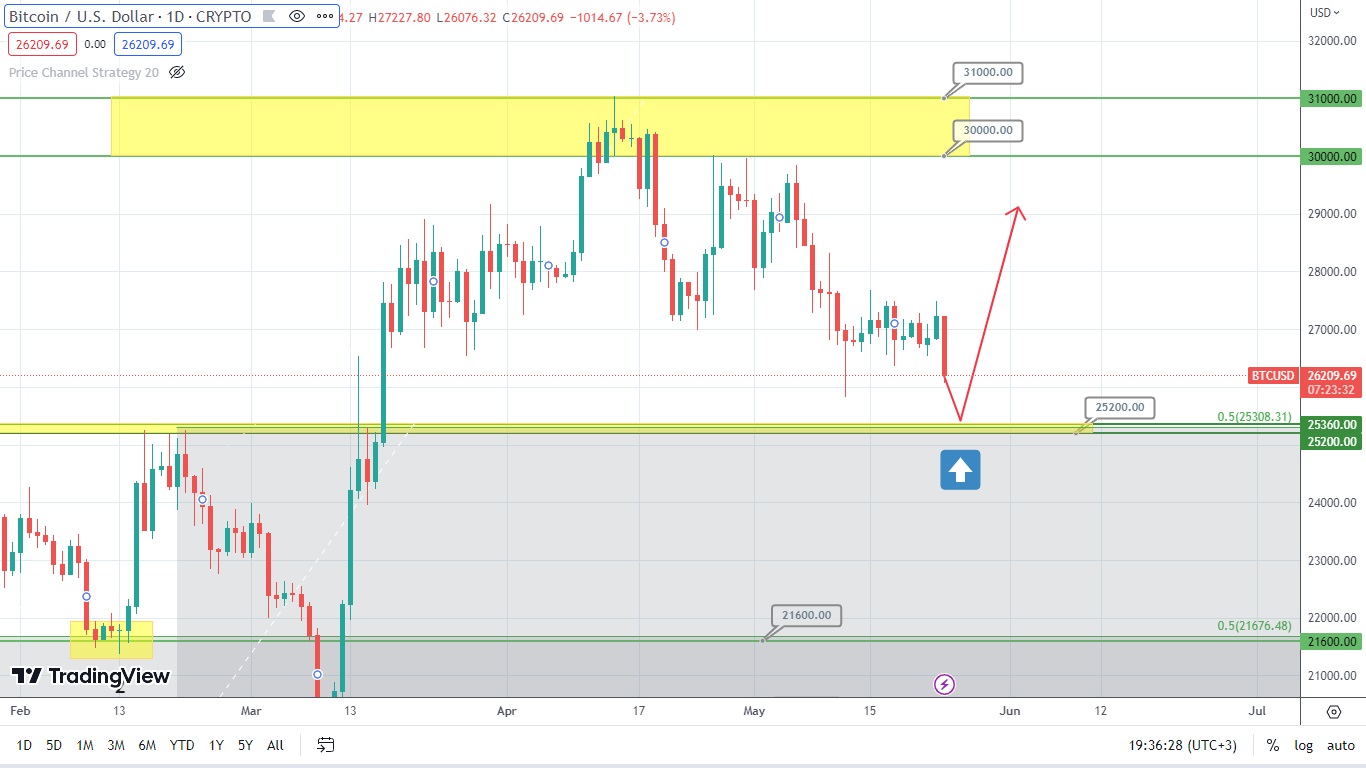
The price of Bitcoin is likely to rebound and head north from the level of 25300. However, it could be interesting to observe the price movements next to this level as the bears might help the asset break the level through.
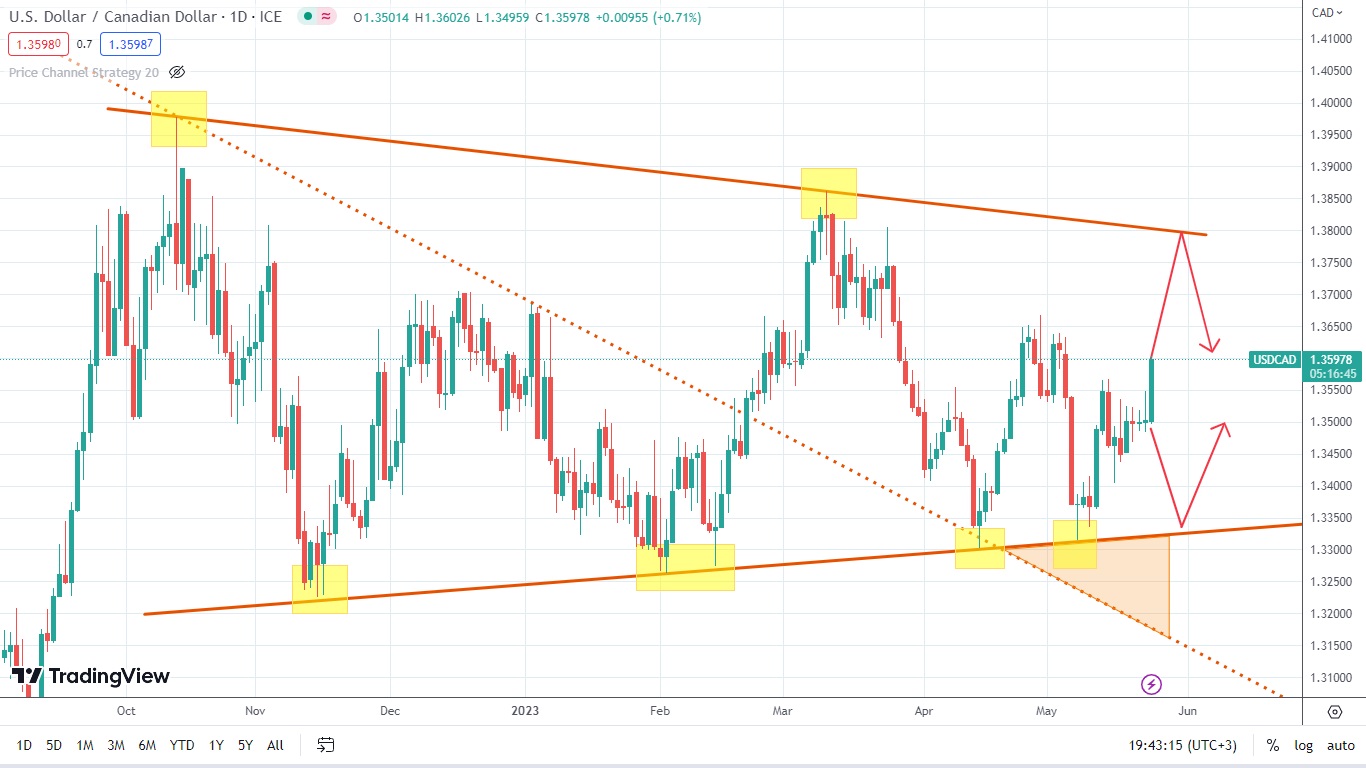
The currency pair USD/CAD has reversed. Now, the asset’s price is approaching the upper side of the symmetrical triangle. Hence, the asset might rebound and drop. The price of this asset can also drop and rebound from the lower side of this triangle. Time will tell what might happen next.
Disclaimer: The material provided is for information purposes only and should not be considered as investment advice. The views, information, or opinions expressed in the text belong solely to the author, and not to the author’s employer, organization, committee or other group or individual or company.
Past performance is not indicative of future results.
High Risk Warning: CFDs are complex instruments and come with a high risk of losing money rapidly due to leverage. 69% and 73% of retail investor accounts lose money when trading CFDs with Tickmill UK Ltd and Tickmill Europe Ltd respectively. You should consider whether you understand how CFDs work and whether you can afford to take the high risk of losing your money.
Futures and Options: Trading futures and options on margin carries a high degree of risk and may result in losses exceeding your initial investment. These products are not suitable for all investors. Ensure you fully understand the risks and take appropriate care to manage your risk.